
Research Highlights
(All figures below are subject to copyright, and are allowed to be used only with permission from the owner.)
Investigating Global Warming Controls on Tropical Cyclone Rainfall Using Convection-Resolving Model Experiments
Maiqian XIAO
Tropical cyclones (TCs) are often accompanied by heavy rainfall and such extreme rainfall enhancement in warmer climates will at least follow the Clausius-Clapeyron (CC) relation due to the increased water-holding capacity of air as the air temperature rises. In this study, using the convection-resolving Weather and Research Forecasting model, pseudo-global warming (PGW) experiments for SSP2-45 and SSP5-85 targeted at the end of this century were conducted for 22 historical TC cases that had great impacts over the Pearl River Delta region in South China. We found that averaged over all storms, fractional change in extreme TC rain rate exceeds that from the CC relation. Moreover, TC intensity and rain rate enhancement can vary from one storm case to another, despite the same PGW forcing being applied. Further inspection revealed that such rainfall deviation from CC can be attributed to differences in environment parameters such as sea surface temperature, mid-level humidity, and vertical wind shear from the storms’ histories. Among these parameters, mid-level humidity plays the most significant role in controlling TC response variations. The dynamic contribution to TC rainfall enhancement in warmer climates is that stronger TC intensity leads to the strengthening of the planetary boundary layer inflow which increases moisture flux convergence. The stronger projected TC intensity is the reason why there are super-CC rainfall anomalies.
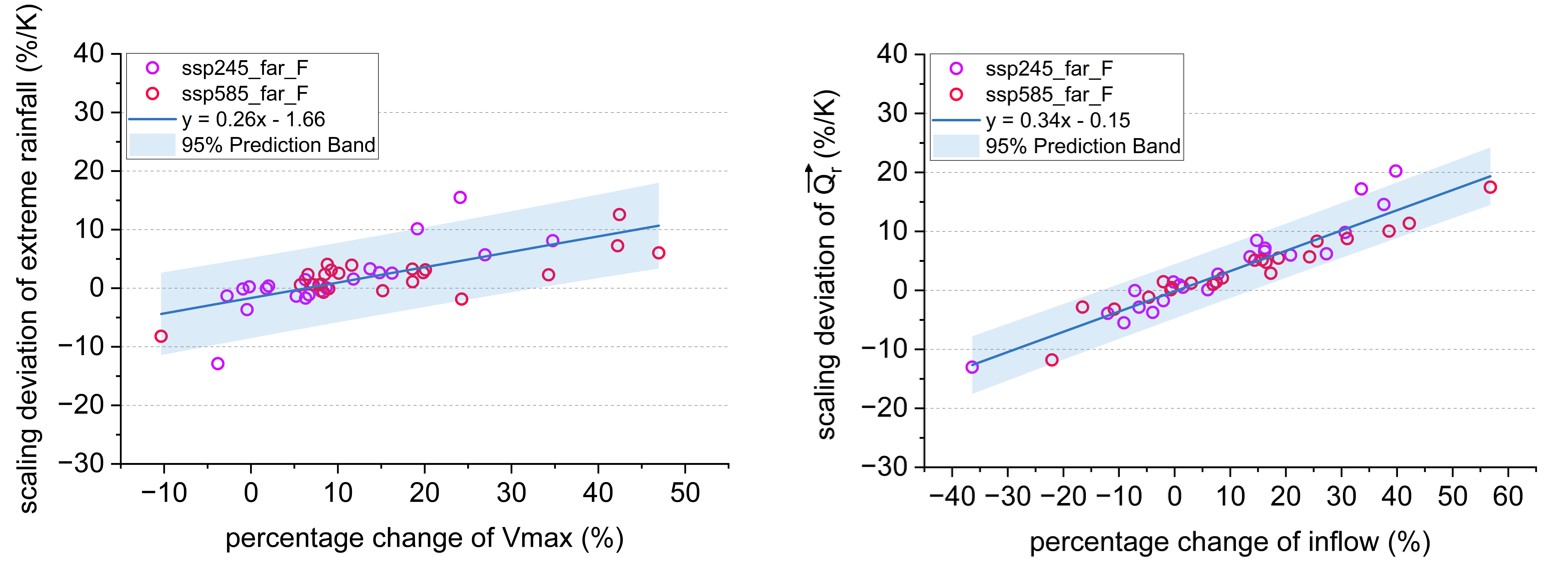
Left: Deviation of fractional change of TC extreme rainfall rate from CC scaling (6.1%/K) vs. percentage change of Vmax of 22 TCs for ssp245_far_F and ssp585_far_F PGW experiments (r squared=0.51); Right: Deviation of fractional change of vertically integrated moisture flux in radial direction averaged at 200 km radius of TC center from CC scaling vs. percentage change of low-level inflow averaged at 200 km radius of TC center (r squared=0.90).
Investigating Heatwaves and Thermal Comfort Under the Influence of Tropical Cyclone in the Greater Bay Area, China
Chung Shing LAU
The Greater Bay Area (GBA) in South China, comprising nine cities and the two special administrative regions, is a highly urbanized and densely populated megalopolis. This makes it particularly vulnerable to heatwaves.
This study investigates the mechanisms, intensity, trends of heatwaves associated with TCs (TC-HW) and those without TCs influence (NonTC-HW) during the warm season (May–September) from 1981 to 2019. Using high-resolution ERA5-Land datasets for air temperature, heatwaves are defined as periods when daily maximum temperature (T-max) exceeded the 90th percentile for at least three consecutive days. Fig. 1 reveals distinct dynamic drivers for the two heatwave types. TC-HW is characterized by periphery of TCs, which strengthens the subtropical high with westward extension, causing anomalous northwesterly winds that suppress sea breeze cooling (Fig. 1a, c). NonTC-HW, on the other hand, is driven by an Omega Block anomaly to the north of the GBA, resulting in upper-level convergence, downdrafts, and anticyclonic flows that also suppress seas breeze and inhibit heat dissipation (Fig. 1b, d). TC-HW is found to be significantly hotter than NonTC-HW in terms of T-max, with difference of approximately 0.9°C, while daily minimum temperature (T-min) difference is minimal. Both TC-HW and NonTC-HW exhibit increasing trends in frequency and duration, but only TC-HW shows a rising trend in heatwave amplitude. Furthermore, UTCI, a measure of human physiological thermal stress, is increasing more rapidly than air temperature in the GBA due to rising vapor pressure and declining wind speeds, highlighting the intensifying human heat stress in the region.
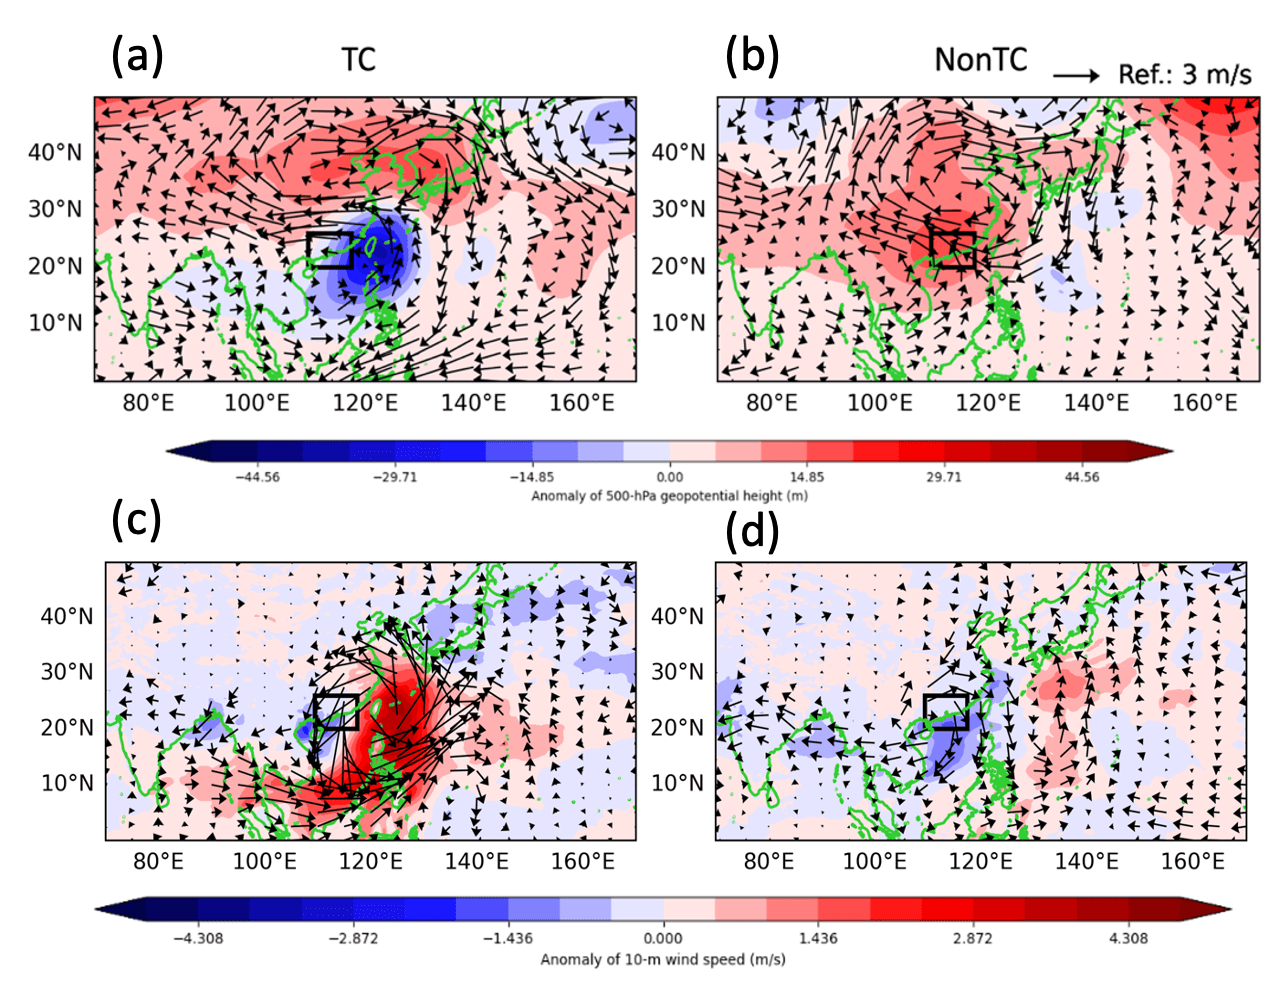
Fig. 1. Composite charts of anomalous (a-b) Z500 (shading) and UV250 (vector), and anomalous (c-d) 10-m horizontal wind speed (shading) and UV850 (vector) for TC-HW and NonTC-HW. Black box denotes the GBA.
El Niño teleconnection changes over tropical Pacific, North America and South to East Asia using CMIP6 under historical and SSP585 forcing
Kei Yiu Bessie LAI
El Niño-Southern Oscillation (ENSO) plays a vital role in influencing the world's climate, including surface temperature and precipitation. It influences its source region in tropical Pacific and these influences also extend to distant regions through teleconnections.
This study aims to compute the time of emergence (ToE) of ENSO-related temperature and precipitation signals using models from the Coupled Model Intercomparison Project (CMIP6), mostly following the methodology of Ying et al. (2022) [1]. It is found that the ENSO-related sea surface temperature (SST) signal over eastern equatorial Pacific (EEP) will emerge in 2050 (Fig. 1), while that of ENSO-related precipitation (PR) over EEP already emerged in 2016 (Fig. 2), which is around 30 years earlier than that of ENSO SST. Outside the tropical Pacific, the ENSO-related air-surface temperature (TAS) teleconnections signal over northern North America (NAM) will emerge in 2077, and the ENSO PR teleconnections signal over California will emerge in 2030. The South to East Asia (SEA) region is also examined, where the ENSO PR teleconnections signal over Philippines is projected to emerge in 2048. Currently, more models have been included to recalculate the ToEs to investigate whether their values are sensitive to the model combinations used.

Fig 1. Signal and ToE of DJF ENSO SST over EEP. a, Signal of DJF ENSO SST of 9 models and the MMM under historical forcing and SSP585 emission scenario. The dashed horizontal black line is the MMM threshold value of the noise and the solid vertical black line is the ending year of the 30-year window when the MMM signal exceeds the threshold value, i.e. the ToE. b, ToE of DJF ENSO SST of 9 models and the MMM under historical forcing and SSP585 emission scenario. Missing bars denote that the signals do not emerge before 2099 for these models.

Fig 2. Signal and ToE of DJF ENSO PR over EEP. a, Signal of DJF ENSO PR of 9 models and the MMM under historical forcing and SSP585 emission scenario. The dashed horizontal black line is the MMM threshold value of the noise and the solid vertical black line is the ending year of the 30-year window when the MMM signal exceeds the threshold value, i.e. the ToE. b, ToE of DJF ENSO PR of 9 models and the MMM under historical forcing and SSP585 emission scenario. Missing bars denote that the signals do not emerge before 2099 for these models.
[1] Ying, J., Collins, M., Cai, W., Timmermann, A., Huang, P., Chen, D., & Stein, K. (2022). Emergence of climate change in the Tropical Pacific. Nature Climate Change, 12(4), 356-364. https://doi.org/10.1038/s41558-022-01301-z
The Risk and Dynamics of Unprecedented Summer Monsoon Rainfall Over Southeast China Under the Current Climate
Man Nam WONG
Extreme summer monsoon rainfall could cause catastrophic social-economic impacts, but it is difficult to anticipate its risk due to limited historical records. In this study we apply the UNSEEN method (UNprecedented Simulated Extremes Using Ensembles) by ampling large ensemble climate model simulations of the Met Office seasonal prediction system GloSea6. We first perform fidelity tests on regions in Southeast China and show that the model and observation of summer rainfall are statistically indistinguishable. We find that the probability of an unprecedented summer monsoon rainfall over Southeast China is about 5% (up to 9%).
The circulation dynamics associated with such events is also examined. For regions close to the western north Pacific, a strengthened western Pacific subtropical high (WPSH) leads to anomalous low-level southerlies onshore to Southeast China, thereby contributing to heavy rainfall there. For regions along 35°N, unprecedented events are often associated with an upper-level stationary wave pattern along the climatological jet, inducing vertical motion conducive to convection. For regions along 25°N, extreme rainfall events are often associated with a southward shifted subtropical jet. Finally, the importance of the shifted jet and the WPSH strength in generating the unprecedented rainfall in the southern regions along 25°N is also investigated. A southward-shifted jet could lead to extreme rainfall in the southern regions even when the WPSH displacement is not strong. Overall, anomalous upper-level flow and WPSH activity can be equally important in triggering unprecedented summer rainfall in Southeast China.
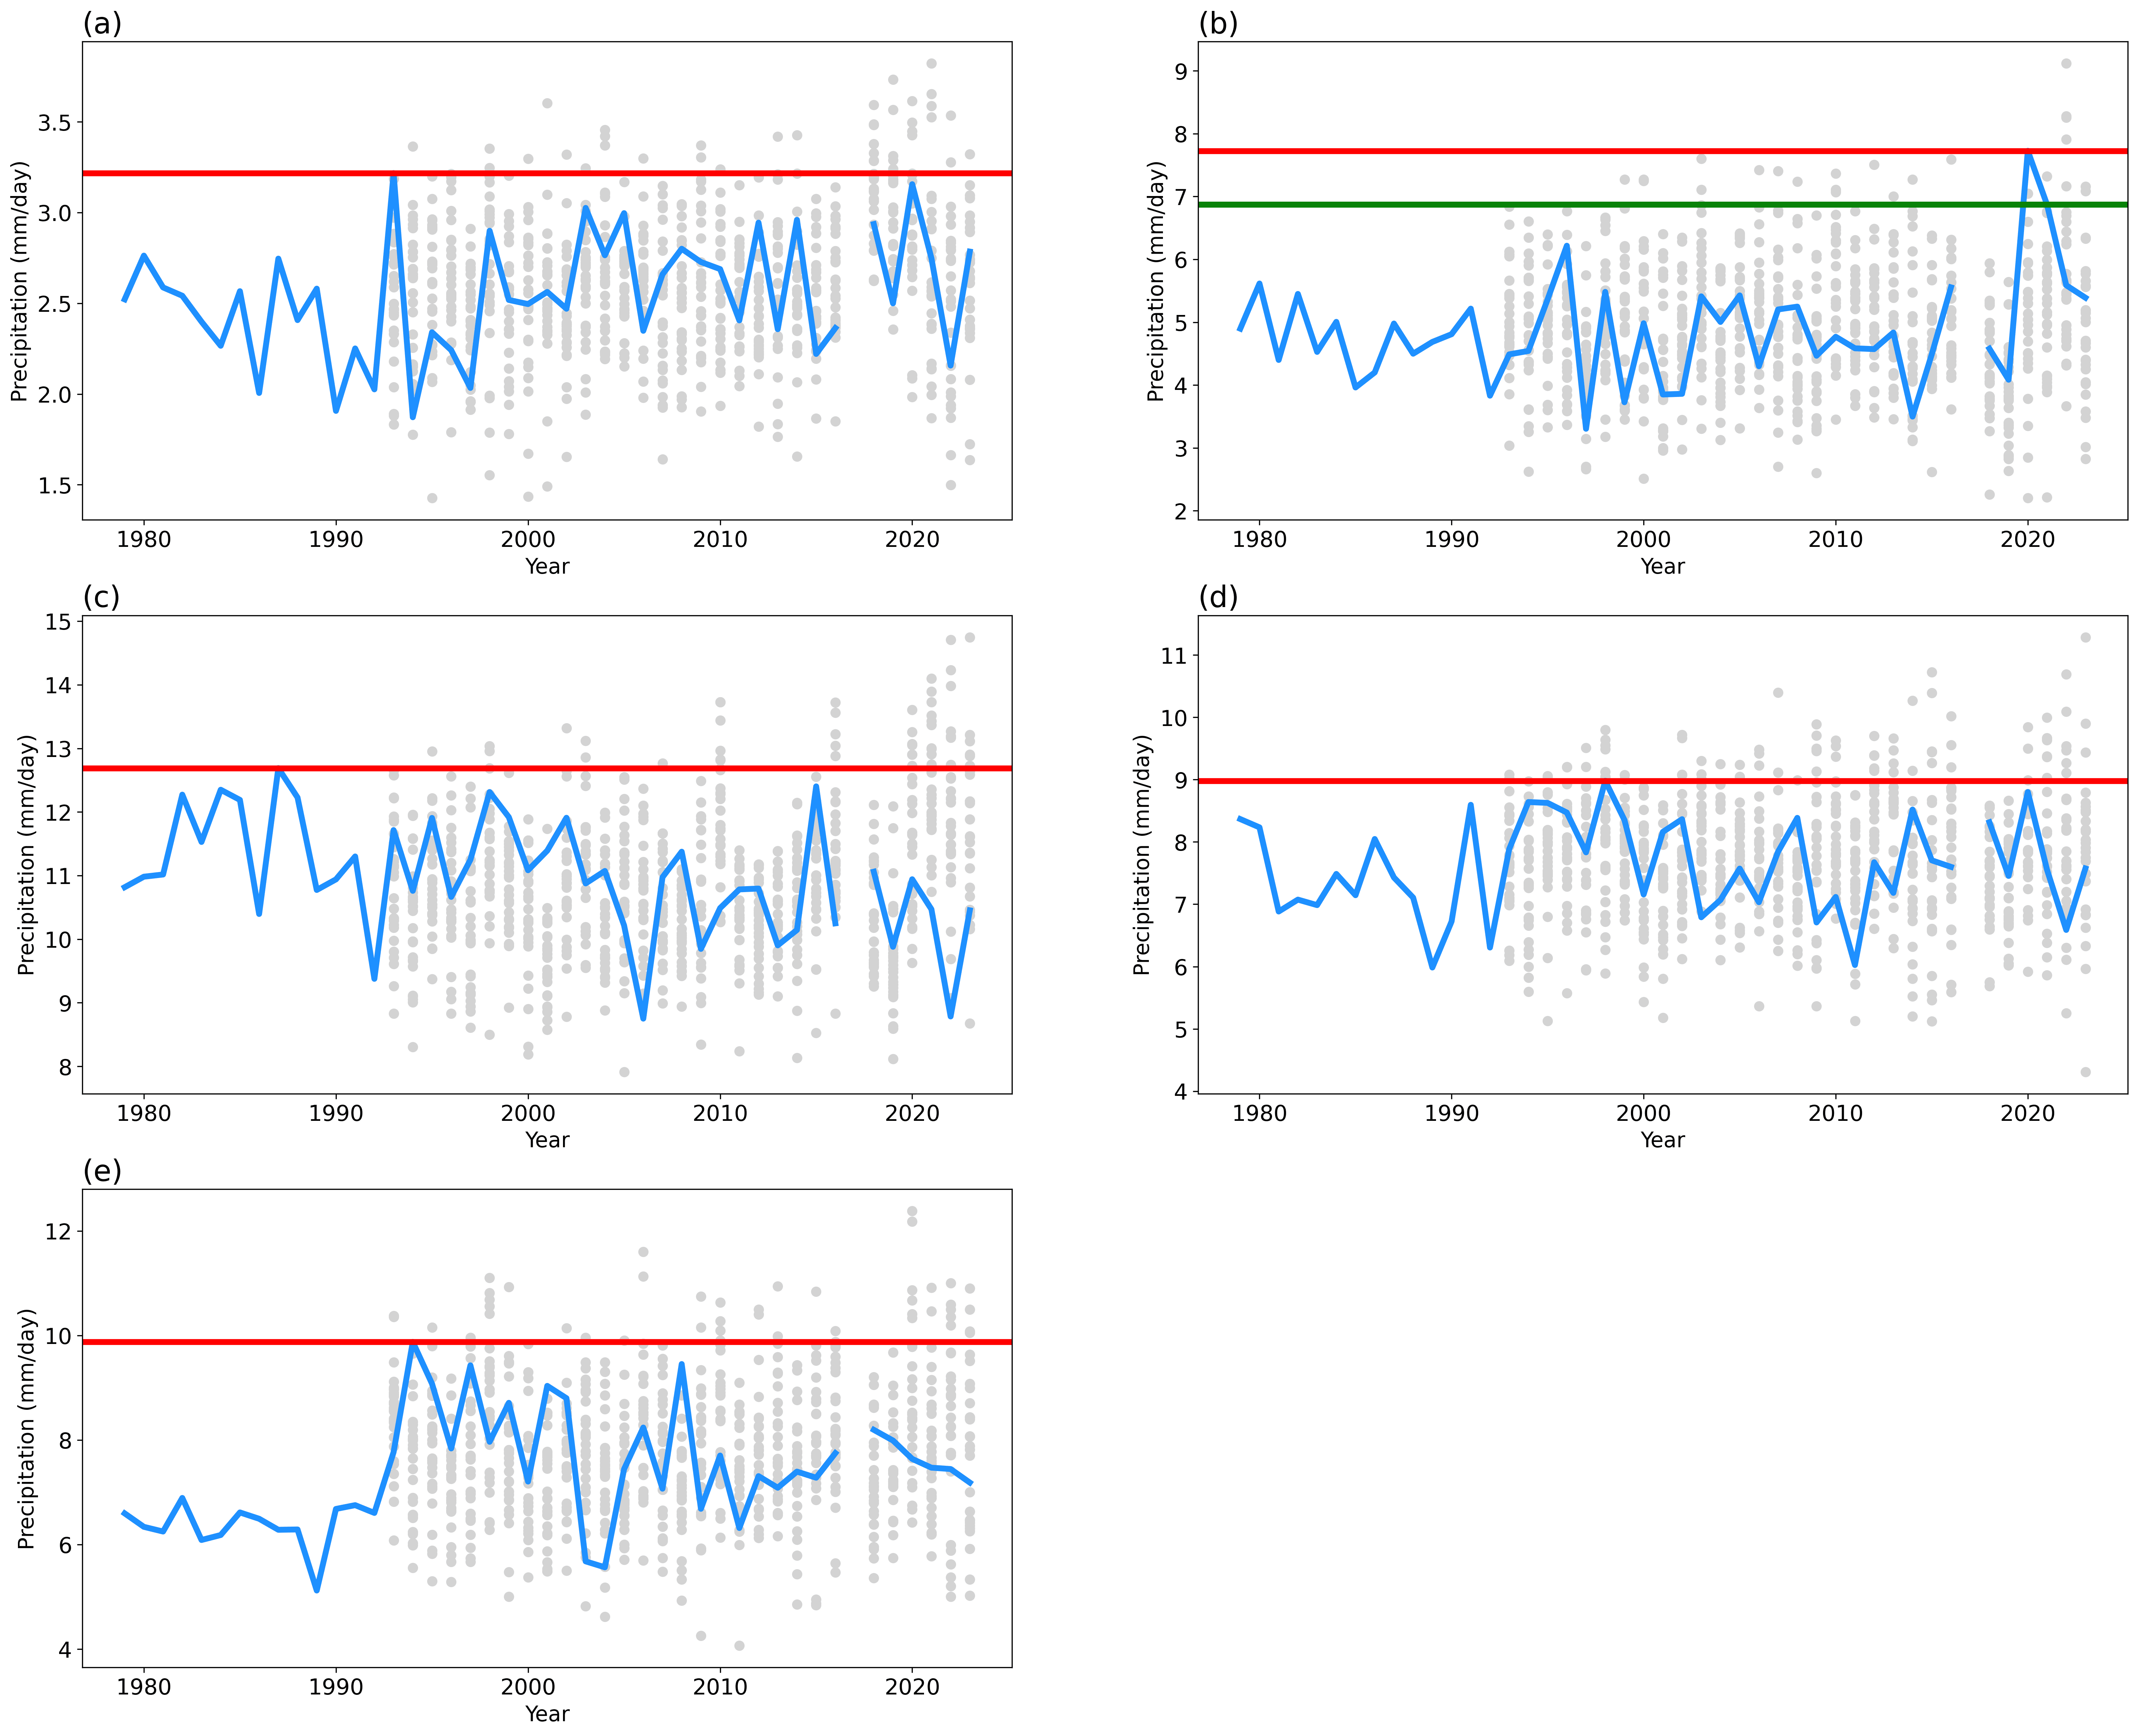
Fig. 1. Observed and simulated rainfall over five regions in Southeast China that have passed the fidelity tests. The observed rainfall time series over each box from 1979 to 2023 (2017 is unavailable) is shown in blue. The red line indicates the maximum rainfall observed over this period. The green line in panel (b) indicates the second-maximum rainfall observed over this period. The grey dots indicate the twenty-eight model simulations from GloSea6 of each year. Units are in mm per day. Note that the vertical scales are different across the panels.